
Having eased past Labor Day, we are now officially into the 2018 General Election campaign season. Here are some important dates to keep in mind:
- October 9 — Final day to register to vote in this election
- October 22 — Early voting starts
- November 2 — Early voting ends
- November 6 — ELECTION DAY
As a profession, architects can take pride in registering at a higher percentage than the general population—but not by that much. Following this year’s March primary election, we ran the participation numbers, and here’s what we learned—
Statewide Voter Reg. = 15,249,541 (76.63% of Voting Age Population of 19,900,980)
TxA Voter Reg. = 5,633 (77.24% of VAP of 7,292)
Better, but not overwhelmingly so.
Now, how about the voting numbers? Here you begin to differentiate yourselves—or at least you do in presidential election years. Over the last few elections, here’s how TxA members rank contrasted with the general population’s voting percentage—
TxA General
2018 Primary 29% 17%
2016 General 91% 59%
2016 Primary 60% 30%
2014 General 59% 34%
2014 Primary 16% 14%
Over this same period, data from the Texas Secretary of State’s Elections Division shows that 77.3% of TxA members have voted in at least one election since 2014. We don’t have a specific general populace number to compare that with but are confident that whatever that percentage is, it is well below TxA’s over-75% mark. The big questions now are: will you vote at that higher rate than the general population does in the 2018 General Election; and, 2) more importantly, will voters again participate at comparably higher rates (36.5%) in the general election relative to the primary voters?
There are several hotly contested federal races (U.S. Senate and Congress), and at least three Texas Senate races in play (versus one in 2014) plus 16 state House races where there might be a change in party (versus 10 four years ago). A huge question that pundits were trying to determine as Labor Day slid by is whether “coattails” will be ridden based on federal or state races. (Interesting note: this is the last election straight-party/ticket voting is allowed, so where any coattails start is a BIG deal. From 2020 on, every voter must check each candidate’s name for a vote to be included in the total.) Despite the fact that this is not a presidential election year, that current office-holder will impact vote totals; it’s a question of how much more NEW turnout is generated—as much as whether it’s “Fer” or “Agin.”
More from the TX Secretary of State (SoS)—
In doing the side-by-side comparison of our membership roster with the SoS voting history records from 2014 forward we came up with a huge amount of data, which allowed us to look at our membership several different ways.
As a general rule, architects are more “reliable” voters, something that’s to be expected given the level of education achieved, attention to surrounding civic and cultural detail (i.e., aware or attuned to your environment), etc…so pat yourselves on the back for that. Within the profession, however, how do architects compare with each other and the general population? Here are three filters we put to that raw data—

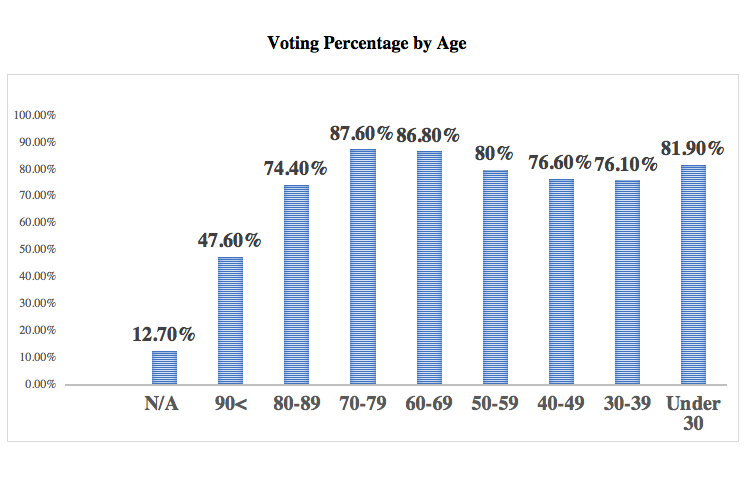

Although I started this review with an expectation that our smaller chapters would have higher participation percentages than their urban counterparts, it’s virtually impossible to identify a pattern like that. Lubbock, the highest percentage chapter (94%), neighbors the one with the lowest, Amarillo (49%); neither is large enough to employ local staff, they drink from the same Ogallala water supply and share many state Representatives and Senators. (The next two components at the top of the list are the Northeast section of AIA Dallas at 87% and the Abilene chapter at 85%. At the low end of the scale are the Brazos and Wichita Falls chapters with 67% and 69%, respectively.)
Among staffed chapters, Austin is #1 with 83% down to Dallas’ low of 70%; all the others are within a five-point range from the mid-70s to low 80s.